You found a bug. Now you need to report it. You could type out a paragraph in Slack, attach a screenshot, and hope someone understands what you mean. Or you could record it.
For years, Loom has been the go-to screen recording tool for teams. It excels at product walkthroughs, async standups, and sales demos. But when it comes to developer bug reports, recording the screen is only half the story.
DevRecorder was built specifically for this problem. It captures your screen and the technical data underneath -- console logs, network requests, errors, and more -- all synchronized in a single recording.
So which one should you use for bug reports? Let's break it down.
What Loom Does Well
Loom is a polished, general-purpose screen recording tool. It's easy to use, works across platforms, and has a massive user base.
For non-technical communication -- product demos, design feedback, async updates -- it's excellent. Here's what you get with Loom:
- Screen and webcam recording with picture-in-picture
- AI transcription and summaries for quick consumption
- Comments and emoji reactions for team feedback
- Integrations with Slack, Notion, and more
If your goal is to show someone what happened on screen, Loom does the job. But if you need to show why it happened -- that's where it falls short.
Where Loom Falls Short for Developers
Imagine you record a Loom of a bug: a button click that does nothing. Your teammate watches the video and sees... a button click that does nothing. Now what?
They still need to:
- Open DevTools and try to reproduce the issue
- Check the console for JavaScript errors
- Inspect network requests for failed API calls
- Dig through the code to find the root cause
The video showed the symptom, not the cause. The developer is still starting from zero.
What DevRecorder Does Differently
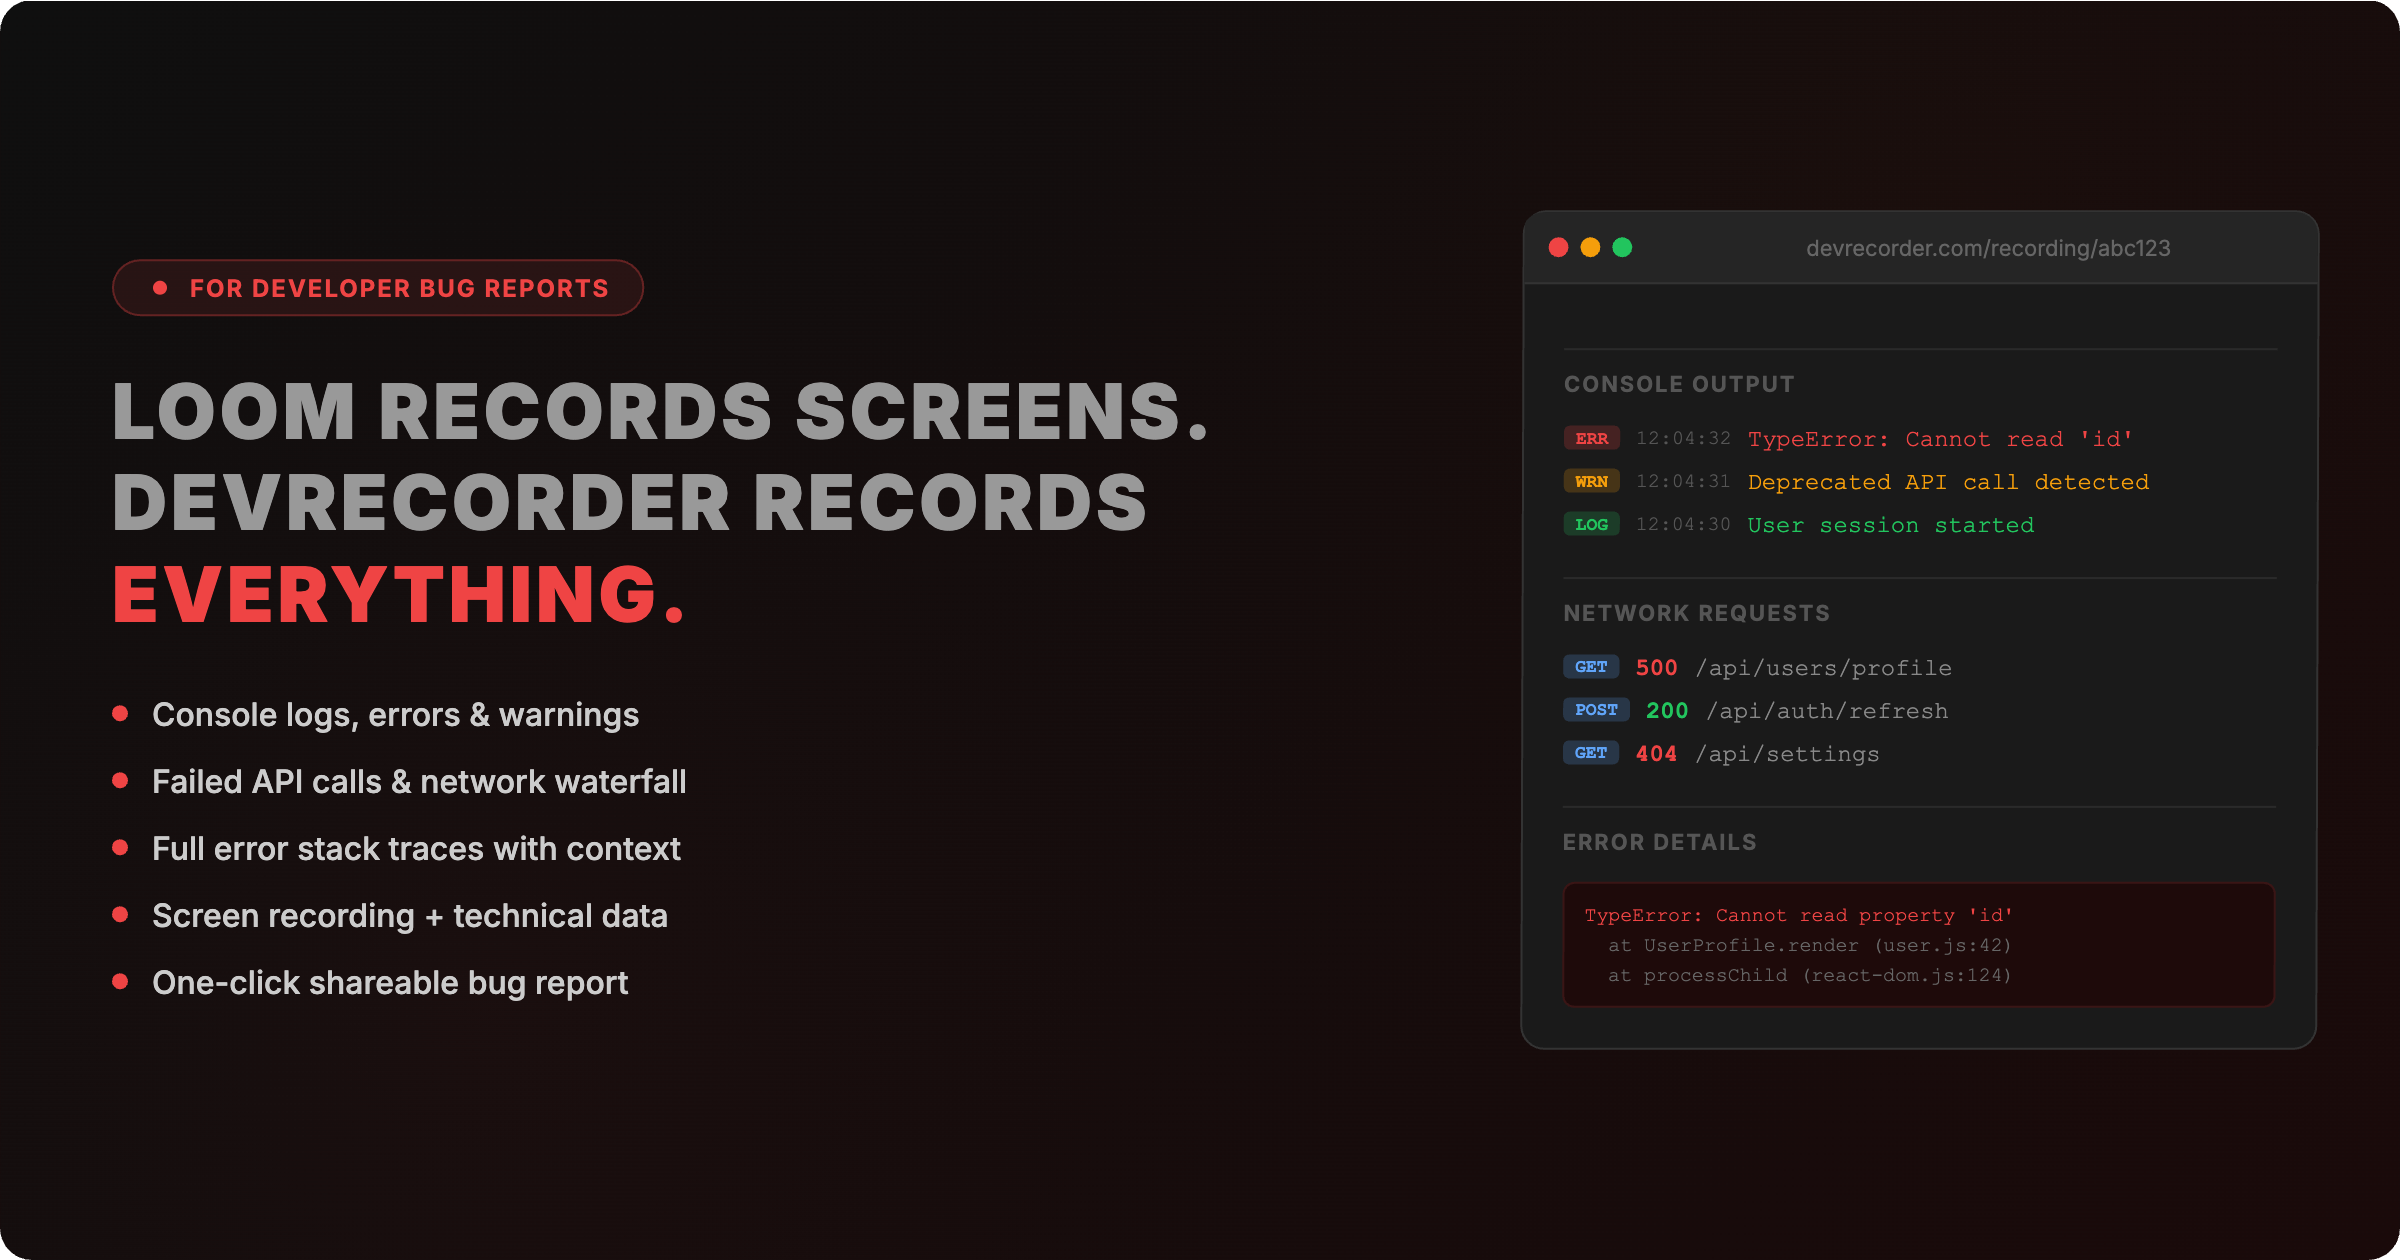
DevRecorder is a Chrome extension built specifically for developer bug reports. When you hit record, it captures everything a developer needs to debug the issue.
Console Logs, Warnings, and Errors
Every console.log(), console.error(), and console.warn() is captured in real time and synced to the video timeline.
When your teammate watches the recording and sees the button fail, they can immediately see the TypeError: Cannot read property 'id' of undefined that fired at that exact moment. No DevTools required.
Network Requests and Responses
Every fetch() and XMLHttpRequest is logged -- URL, method, status code, headers, and response body.
A button that does nothing might be caused by a 500 Internal Server Error from /api/orders/submit. With DevRecorder, that's visible instantly. No need to reproduce.
Full Error Stack Traces
When a JavaScript error occurs, DevRecorder captures the complete stack trace -- not just the message, but the exact file, line number, and call stack. This alone can cut debugging time from hours to minutes.
Synchronized Timeline
This is the key differentiator. All technical data is synchronized with the video. Click on a network error in the timeline, and the video jumps to that moment. See a visual glitch in the video, and instantly check what console errors and API failures happened at the same time.
Side-by-Side Feature Comparison
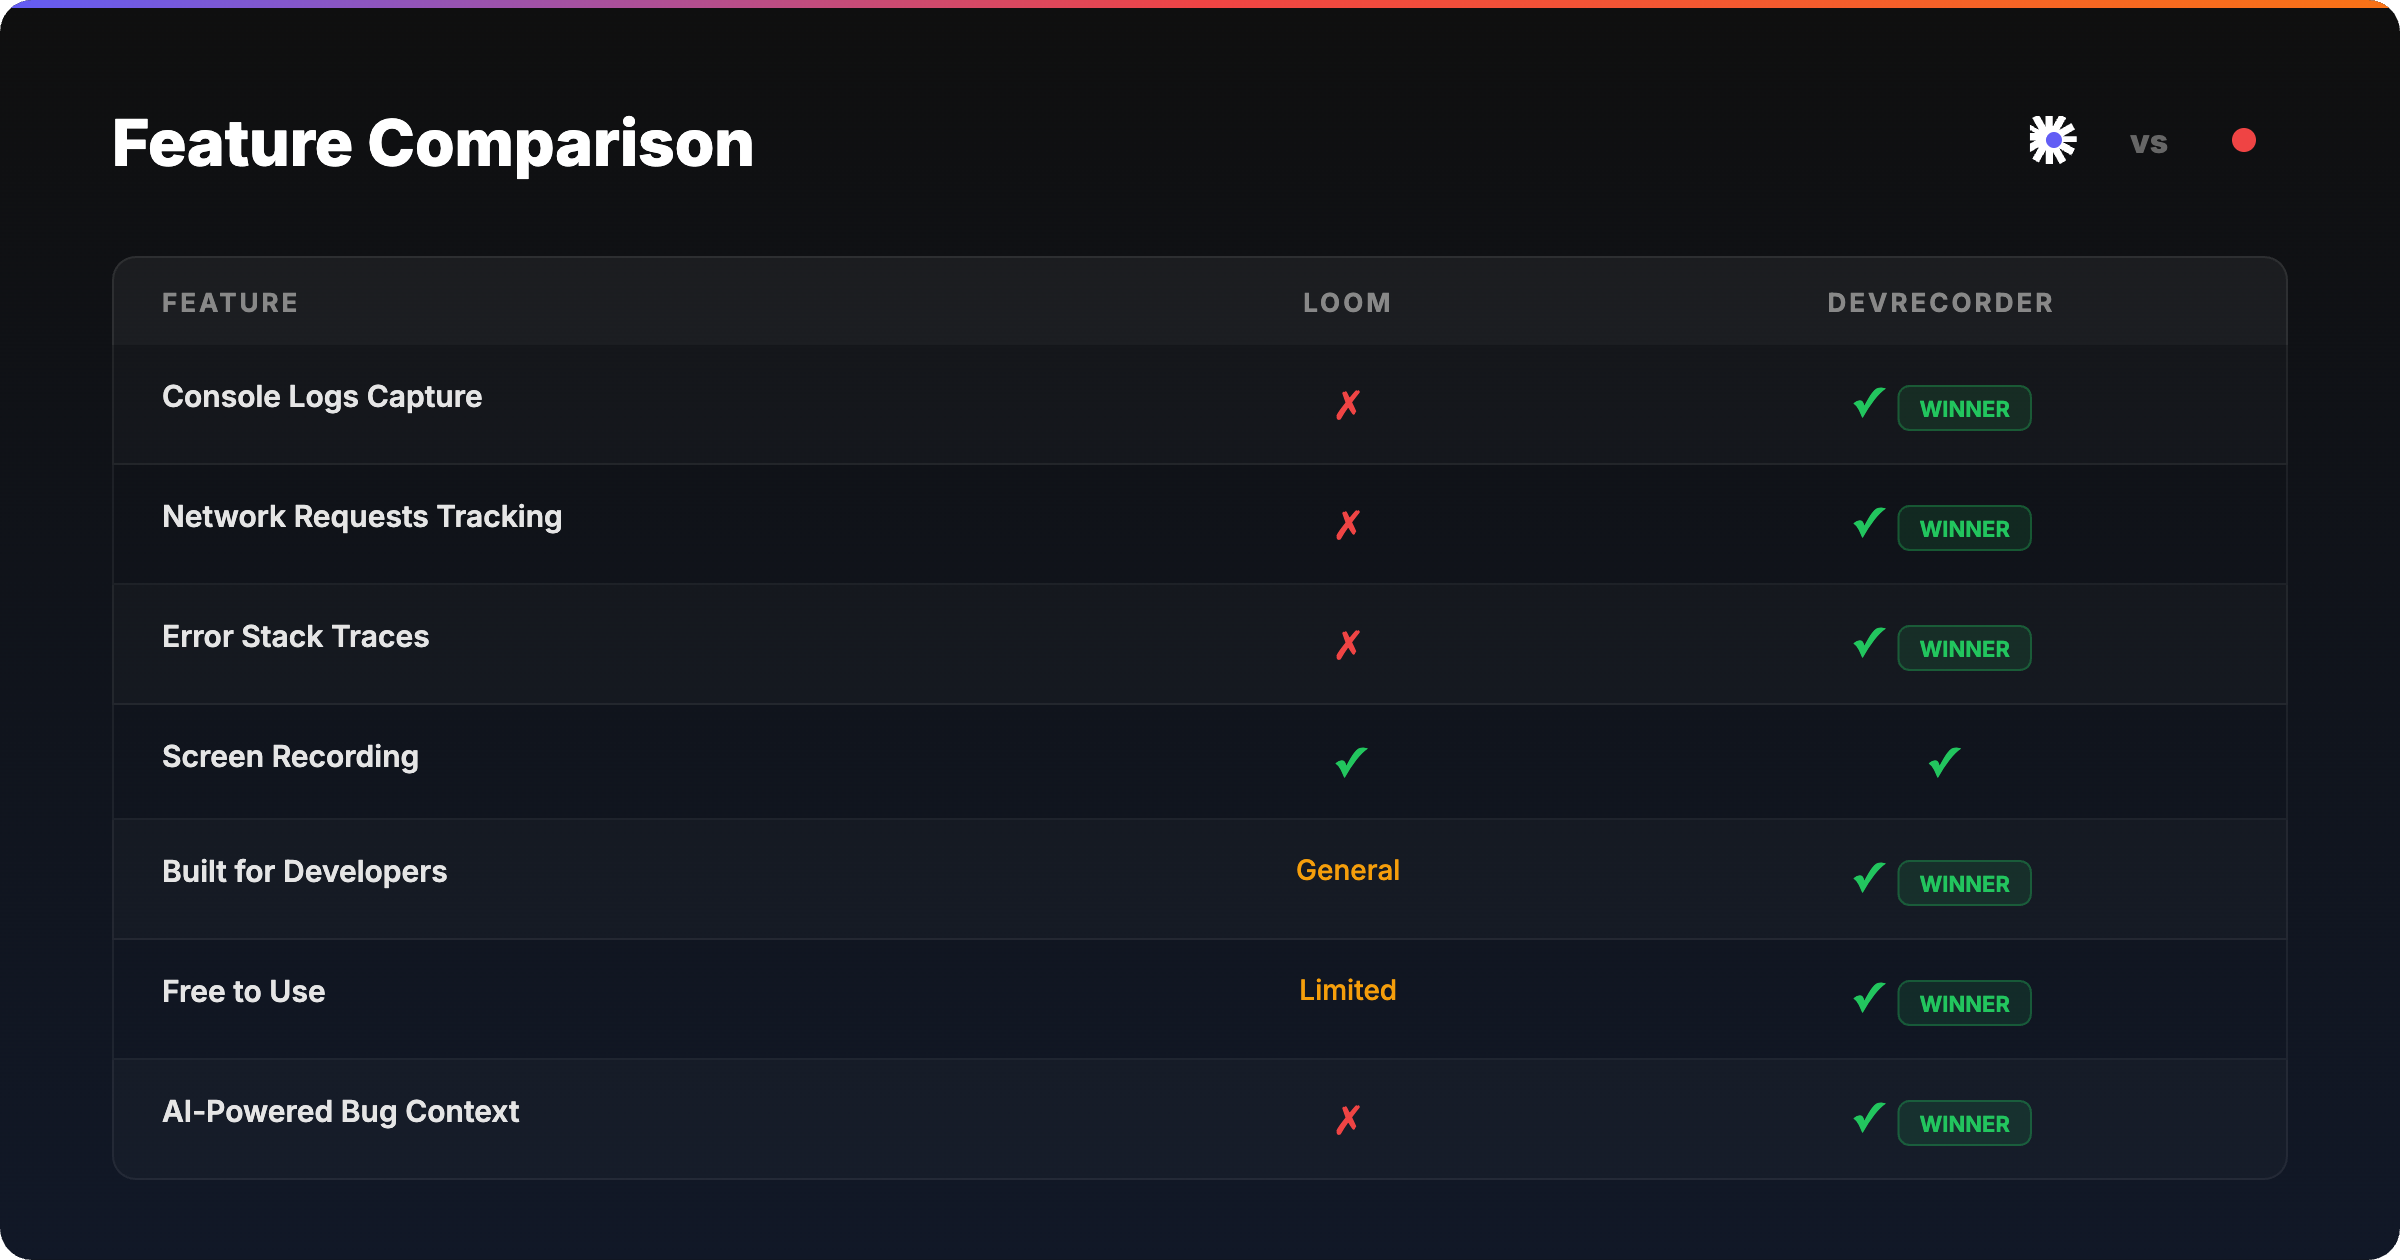
Here's how Loom and DevRecorder compare for developer bug reporting:
| Feature | Loom | DevRecorder |
|---|---|---|
| Screen recording | Yes | Yes |
| Console log capture | No | Yes |
| Network request tracking | No | Yes |
| Error stack traces | No | Yes |
| Synchronized timeline | No | Yes |
| Built for developers | No (general purpose) | Yes |
| Webcam overlay | Yes | No |
| AI transcription | Yes | No |
| Shareable link | Yes | Yes |
| Free tier | Limited (25 videos) | Free forever |
| MCP integration for AI tools | No | Yes |
Real-World Scenario: Checkout Page Crash
Let's say a user reports that the checkout page crashes after entering their credit card. Here's what each tool gives you:
Debugging with Loom
You get a video of someone filling out the form and seeing a white screen. Your developer watches it and says: "Okay, it crashes. Can you check the console? What API call failed?"
Back-and-forth begins. The bug sits in the backlog for two days while context is gathered.
Debugging with DevRecorder
You get a video of the same crash -- plus the console showing Uncaught TypeError: stripe.confirmPayment is not a function, the network panel showing that /api/payment/intent returned a 400 Bad Request with {"error": "invalid_amount"}, and the full stack trace pointing to checkout.js:87.
Your developer watches the recording and opens a fix in 10 minutes.
When Should You Use Loom?
Loom is still the right tool for many use cases:
- Product demos -- showing off features to stakeholders
- Async standups -- quick team updates with face cam
- Design reviews -- walking through mockups or prototypes
- Sales and onboarding -- personalized video messages
If your audience is non-technical and doesn't need debug data, Loom's polish and simplicity make it the better choice.
When Should You Use DevRecorder?
DevRecorder is the right tool when technical context matters:
- Bug reports -- capture the full picture, not just the symptom
- QA testing -- provide developers with actionable debug data
- Debugging sessions -- record and share your investigation
- Frontend incident response -- document what happened with full technical evidence
- AI-assisted debugging -- use MCP to feed recording data directly into AI coding tools like Claude Code or Cursor
The MCP Advantage: AI Meets Debugging
DevRecorder supports the Model Context Protocol (MCP), which means AI coding assistants can directly access your recording data.
Instead of manually copying error messages into a chat, your AI tool can pull console logs, network errors, and stack traces from a recording automatically. This turns a screen recording into a fully queryable debugging dataset -- something no general-purpose recording tool offers.
Learn more about how MCP works in our guide to MCP for developers.
The Verdict: Loom vs DevRecorder
Loom and DevRecorder aren't really competitors -- they solve different problems. Loom records what you see. DevRecorder records what you see and what's happening underneath.
For developer bug reports, the choice is clear: DevRecorder gives your team the technical context they need to fix bugs faster. No more "can you check the console?" No more reproducing issues from vague descriptions. Just one recording with everything in it.
Ready to try it? Get started with DevRecorder for free -- it installs in seconds as a Chrome extension and captures console logs, network requests, and errors alongside your screen recordings. Check out our pricing plans to see what's included.